Learn more
If your resource planning still lives in a spreadsheet that someone updates once a week and emails around, you are in good company. You are also one overbooked senior away from a delivery crisis.
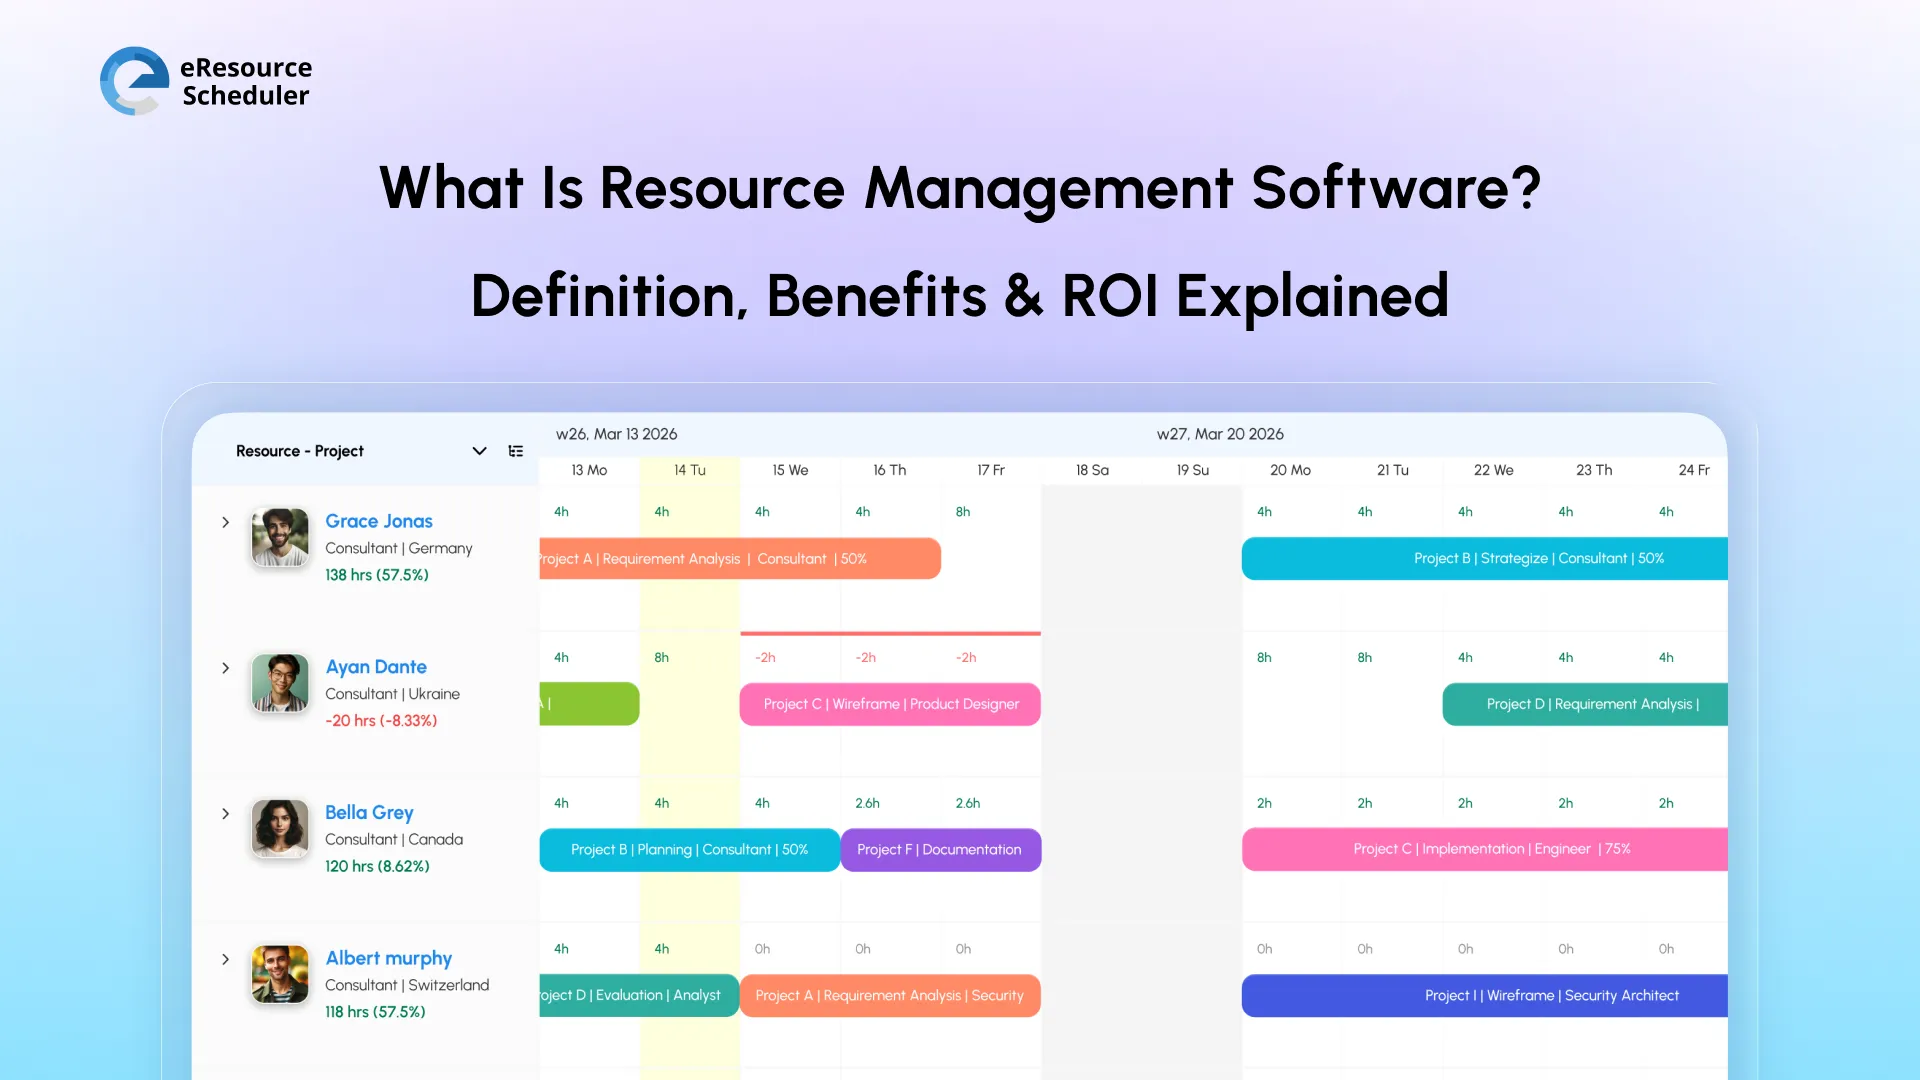
Resource management software is the centralized system you use instead. It connects your resource scheduling software, capacity planning, timesheets, and finances in a single view. So every leader in the room knows exactly who is available, what is committed, and where the cracks are forming before they cost you a client.
In this blog, we break down what resource management software is, why 2026 has made it a boardroom-level priority, the problems it solves, and how to calculate the ROI in a way that gets a budget approved rather than just filed away.
Key Takeaways
• Resource management software connects demand, capacity, and skills in a single system. Replacing scattered spreadsheets.
• The sweet spot for billable utilization in professional services sits between 70% and 80%.
• A 3% improvement in utilization across 120 employees can add approximately $748,800 in annual revenue.
• ROI follows a clear framework. Set a Baseline. Model utilization gains. Quantify cost savings. Account for total investment. Calculate net impact.
Before jumping into the resource management software part, let’s understand what the software is actually designed to do, i.e., managing resources. Our blog on ‘What Is Resource Management?’ covers the full picture. But here is the short version.
Resource management is the process of planning, assigning, and tracking your people, time, and budget across every active project. At a strategic level, it connects demand (what work needs doing), capacity (who is available and when), and capability (do you have the right skills).
Resource management software is a centralized system that brings these three (demand, capacity, and capability) together. It integrates resource scheduling, timesheets, financials, reports, resource capacity planning, and cross-functional dashboards in one place. When a project shifts margins, capacity updates show up right away. When utilization trends are in the wrong direction, you get an alert before it can affect delivery.
Beyond people, resource management software also helps in tracking financials, physical assets, and shared digital resources. Connecting all dimensions rather than treating them as individual entities.
Resource Management Software delivers the most value wherever limited, skilled people serve multiple overlapping projects. Professional service firms. IT teams. Engineering organizations. Management consultancies. Legal and accounting practices. Healthcare organizations.
In every case, the challenge is the same. Projects overlap, demand shifts, skilled people are limited, and financial results depend entirely on getting allocation right. This shared pressure is also something that has pushed resource management software from a back-office function to a boardroom conversation.
Global employee engagement dropped to just 20% in 2025. The lowest since 2020. It costs an estimated $10 trillion in lost productivity worldwide (Gallup, 2026). A significant share of that loss stems from misaligned work, unstable workloads, and leaders who could not see how their resources are deployed.
There is also something called the Profitability Paradox. In professional services, the target billable utilization sits between 70% and 80%. Drop just 2% to 5%, and profitability erodes faster than a paper can capture. Push too far above and you face burnout, attrition and replacement cost that can reach to 50% to 200% of an employee’s annual salary (SHRM, 2025).
Without centralized visibility across all active projects, overbooking becomes the norm. Hiring turns reactive, and forecast accuracy drops. Resource management solutions address this through predictive insights and scenario planning. Shifting teams from reactive firefighting to proactive control.
Many teams already use spreadsheets, project management tools, ERP systems, or HR platforms. Here is how resource management software sits differently.
| Tool | What It Does Well | Where It Falls Short | How Resource Management Software Fills the Gap |
| Project Management Tools | Tracks tasks, milestones, and deadlines | Limited cross-project visibility; cannot forecast long-term capacity | Portfolio-wide utilization and allocation across all projects, not just task execution |
| ERP Systems | Handles accounting, budgeting, and payroll | No day-to-day scheduling; mostly backward-looking | Connects allocation decisions to real-time financial impact with forward-looking capacity planning |
| HR Systems | Stores employee records and compliance data | Does not track live workload or cross-project assignments | Shows how people are deployed across initiatives and how workload affects margins |
| Spreadsheets | Flexible, low barrier to entry | Version conflicts, manual updates, no automation, hard to scale | Centralizes data, updates in real time, includes scenario modeling and utilization tracking |
These tools are not the wrong choices. Resource management software becomes the layer that fills the allocation and forecasting gap, none of which are designed to address.
Most organizations adopt a resource management tool after the same friction points start repeating themselves. These are the four patterns that block the road the most.
Department heads maintain separate spreadsheets for planning. Sales, delivery, and finances all work from a set of data. Result? No single source of truth. eResource Scheduler brings your entire resource pool onto one centralized view. So every leader sees who is available, who is booked, and what everyone is working on.
In a 150-person consulting firm, even 5% overallocation can mean 300 or more overtime hours per quarter. eResource Scheduler gives managers a clear visual breakdown of resource assignments through its Gantt chart scheduler. Showing who is swamped, who is coasting, and where the workload needs to be recalibrated. Before overutilization turns into a delayed project or resignation.
Idle time stays invisible when planning is scattered. Quietly draining revenue every quarter. eResource Scheduler’s utilization reports show exactly who is genuinely contributing and who has capacity sitting unused, broken down by resource, role, or project. Managers can spot underutilized team members and reassign work before that capacity can go to waste. For the flip side of this problem, our blog on understaffing and capacity gaps is worth reading alongside.
When capacity shortages are identified late, the responses are costly. Rush recruitment, premium contractors, or extended overtime. eResource Scheduler’s capacity forecasting lets you filter by skill, role, or team to see who has capacity available. Whether it’s next week or next quarter, it gives leaders time to plan a hire properly or redeploy someone internally before it becomes a crisis.
Want to see these features in action?

Solving these problems is what resource management software is built to do. Here is what it looks like in practice.
Mature resource management software platforms share a core set of capabilities that connect planning, execution, and financial performance.
1. Resource Scheduling: Assign people based on skills, availability, and project priority across multiple initiatives simultaneously.
2. Capacity Planning and Forecasting: See future workload against available hours weeks or months ahead. Our best capacity planning tools comparison is a useful read if you are specifically looking for this feature.
3. Management Reports: Generate executive-ready reports on utilization, availability, capacity, and planned vs actuals without manual compilation.
4. Timesheets: Compare planned allocations against actual efforts to sharpen forecasts and highlight margin gaps. See how dedicated timesheet tools stack up for resource-driven teams.
5. Financial Tracking: Connect allocation decisions to cost rates, billing rates, budget performance, and project margins.
6. Cross-Functional Dashboard: Get a unified view of all active projects, workforce distribution, resource availability, and capacity utilization.
7. Scenario-Modeling: Simulate staffing and scheduling adjustments and see the financial impact before committing to anything.
These features do not just solve operational headaches. Together, they create an ecosystem that shows who is working on what, when, how much, and what it means for your bottom line.
If your billable team runs at 70% utilization instead of 75% utilization, the gap across 100 people is not a rounding error. It is a six-figure problem hiding quietly in your P&L every quarter.
Pro Tip:
Utilization is the heartbeat of your Profit and Loss statement. In a large project-driven organization, even a 1% improvement in effective utilization can add hundreds of thousands, sometimes millions, to annual revenue.
Hidden bench time and small allocation gaps rarely appear as dramatic losses in any one quarter. They accumulate quietly, quarter after quarter. Until what looked minor becomes a consequential margin erosion factor.
Visibility is what turns these hidden leaks into measurable gains.
American Express faced a large, distributed workforce spread across overlapping projects with limited visibility into true availability and skill coverage. By implementing eResource Scheduler, the team gained live allocation views, early capacity gap forecasting, and data to align staffing with financial targets.
The result was a measurable improvement in utilization and a significant drop in reactive staffing costs. Read the full American Express case study for the complete breakdown.
Capterra’s 2025 Tech Trends Survey established that 70% of financial organizations have regretted a recent software purchase. One of the most common reasons: No clear way to measure whether the investment was working.
Calculating the ROI of your resource management software is how you prove the tool is earning its place.
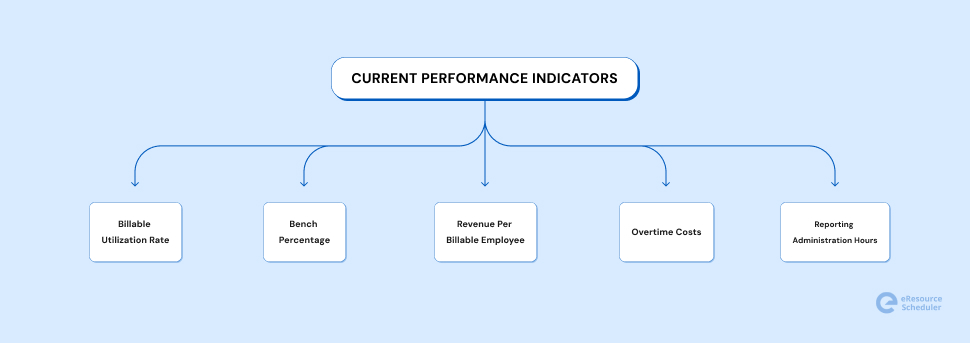
Step 1: Establish your Baseline
Capture your measurable operational and financial metrics.
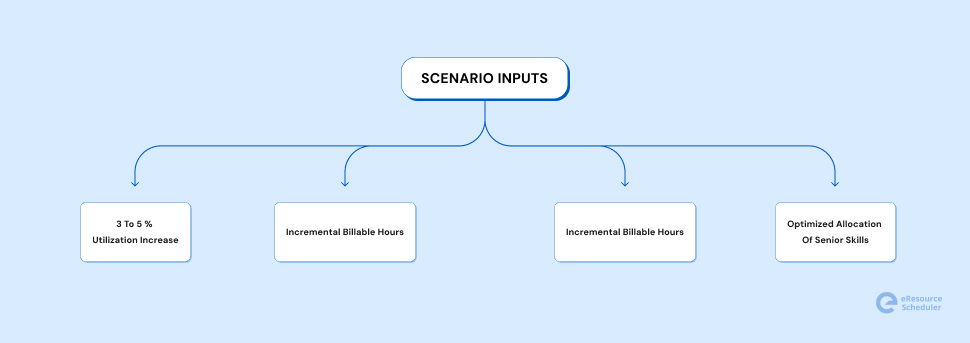
Step 2: Model Utilization Improvement
Project the revenue impact for effective utilization. Even conservative assumptions produce compelling numbers at scale.
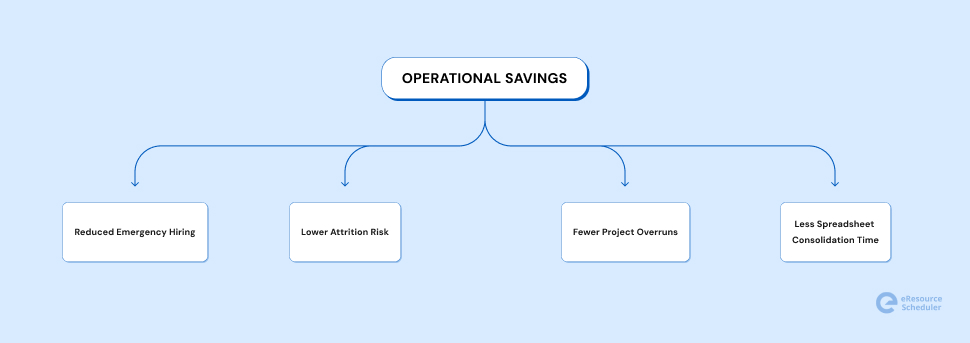
Step 3: Quantify Cost Avoidance
Calculate savings from increased resource visibility.
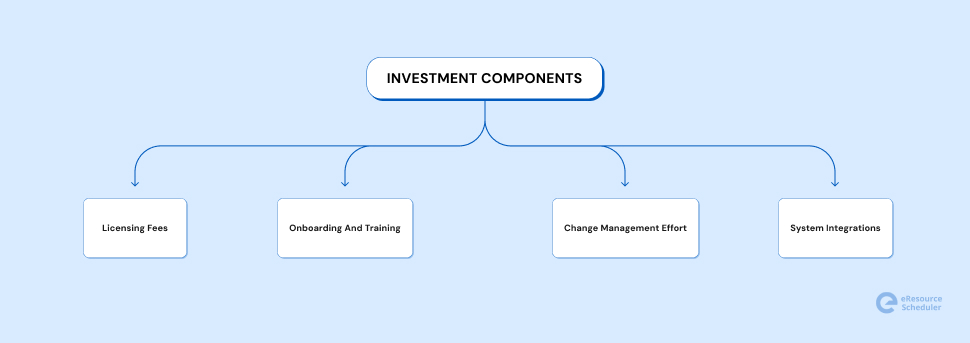
Step 4: Account for total Investment
Maintain transparency at this stage to reflect full financial commitment.
Step 5: Calculate Net Impact
With projected gains and total costs now having character, calculate the net return.
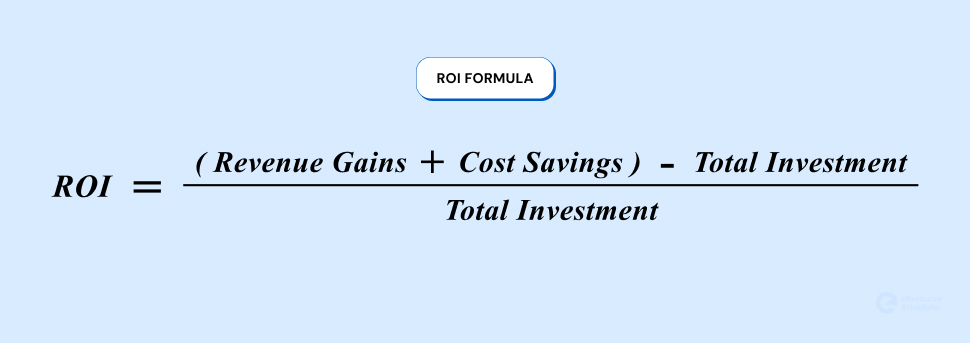
(Data Note: This is a modeled scenario for illustration purposes only.)
Let’s put this theory to the test. A management consultancy with 120 billable consultants. Each is billed at $130 an hour, for 1,600 available hours a year. They are currently running at 72% utilization.
At this rate, their annual revenue works out to be:
120 x 1600 hours x 72% x $130
$17,971,200/-
Now, implementing resource management software has promoted better resource visibility. This, in turn, increased the utilization by 3%. Bringing it to 75% utilization.
Now their annual revenue is:
120 x 1600 hours x 75% x 130
$18,720,000/-
This single shift adds $748,800 to the annual revenue. That too, without hiring a single additional person.
Three percent. This is the difference between where most teams are today and where they could be with the right visibility in place.
For a deeper look at which resource management software will actually move those numbers for your organization, the resource management solution comparison covers exactly this.
Selecting a resource management software is not about the longest feature list. It is about finding what fits how your team actually plans, delivers, and measures performance.
| Evaluation Area | What to Look For | Why It Matters |
| Forecasting Capability | Capacity visibility weeks ahead; scenario modeling before committing to new work | Without forward-looking data, you are always reacting instead of planning |
| Connected Scheduling, Timesheets, and Financials | Scheduling decisions linked to cost rates, billing rates, and margin tracking | Disconnected systems create blind spots that only surface after project completion |
| Reporting Flexibility | Utilization summaries, margin visibility, and exportable dashboards | Executive reviews need precision, not scattered manual exports |
| Ease of Adoption | Clear interface, short learning curve, accessible for remote teams | A powerful system no one uses creates no value |
| Scalability | Multi-project visibility, role-based access, and advanced skill filtering | Complexity grows; your platform should grow with it |
| Security and Compliance | Role-based permissions, data encryption, ERP, and HR integrations | Resource data is financial data; protecting it is a leadership responsibility |
Choose the software for where you are heading. Not just where you are today.
Early stage firms → Visibility and ease of adoption
Mid-sized organizations → Forecasting and utilization tracking
Large enterprises → Integration depth, reporting sophistication, and multi-region support
Adopting a resource management software does not mean flipping everything overnight. Start by mapping your current capacity. Identify recurring allocation conflicts. Consolidate planning into one source of truth. From there, introduce timesheets gradually. Set consistent planning intervals. Do this till it becomes a part of how your organization operates. Not an added task on top of it. Implement resource management software like a pro and see the magic.
Within the first few planning cycles, you will notice capacity checks that used to take hours now take mere minutes. Allocation conversations are happening before conflicts. This is the real shift. When visibility becomes the default, your team stops firefighting. They start to plan with confidence.
To explore how centralized visibility can support your resource management approach, book a personalized demo with us today.

Plan Smarter. Schedule Faster. For Free.
Join thousands already using eResource Scheduler to align teams, time, and tasks seamlessly.
 ALL FEATURES INCLUDED