Have you ever paused during a budget review and wondered what FTE means and why everyone cares about it so much? You’re asking the correct question.
Full-time equivalent (FTE) is more than an HR metric. It is a crucial factor for hiring approvals, project feasibility, revenue forecasts, compliance reporting, and even burnout prevention. For managers and leaders, understanding the meaning of FTE clearly can prevent costly staffing misjudgements.
FTE Meaning
FTE stands for Full-Time Equivalent. It is a standardized workforce metric
that converts total hours worked into the equivalent number of full-time employees based on a defined full-time
schedule.
This guide explains what FTE is, how to calculate it, and where it fits into capacity planning, financial reporting, and cross-project workforce visibility. It also delves into how centralized resource management software brings everything together.
In simple terms, FTE converts total hours worked into the number of full-time equivalent employees. If your company defines full-time as 40 hours per week:
The standardization allows leaders to measure workforce capacity accurately, regardless of how many part-time, contract, or hybrid employees are involved.
Industry Insight:
As hybrid and fractional roles grow, organizations are relying more on
FTEs rather than headcount to evaluate real capacity. Recent U.S. Bureau of Labor Statistics data
confirms that in 2025, about 18.0 % of employed people were working part-time (typically defined as less than 35
hours per week), while the remainder worked full-time.
These figures confirm that nearly one in five workers is
not on a full-time schedule, which is why FTE, a measure that standardizes hours across varied work arrangements,
often provides a more accurate view of real operational capacity than simple headcount alone.
FTEs are widely used across industries:
In project-based environments, FTEs help determine if delivery timelines are realistic. In financial planning, FTE provides a standardized basis for calculating labor costs. In strategic resource capacity planning, it allows leadership teams to compare departments fairly.
Hours measure effort. FTE measures capacity in standardized units. Similarly, Headcount measures the number of employees. FTE measures the workload they collectively represent.
| Metric | Hours | Headcount | FTE |
| What It Shows | Raw time worked | Number of employees | Standardized workforce capacity |
| Decision Impact | Helps identify workload spikes and overtime trends | Influences organizational structure and HR strategy | Supports hiring approvals and budget modeling |
| Best Used For | Payroll, billing, and daily operations | Compliance reporting and org planning | Workforce planning and forecasting |
| Use Case Example | Tracking 45 billable hours logged by a consultant this week | Reporting 25 employees in the marketing department | Determining a project requires 3.2 FTE over the next quarter |
If you rely only on hours, you see activity but not the strain. If you rely only on the headcount, you see people, but not capacity. FTE connects workload to strategic workforce planning.
FTE = Total Hours Worked ÷ Standard Full-Time Hours
In a simplified manner, to calculate FTE, add all hours worked and divide them by what your organization considers a full-time schedule.
Scenario: If your standard is 40 hours per week,
Total weekly hours = 320 Hrs
FTE = 320 ÷ 40 = 8.0 FTEs
This means you have eight full-time workloads available.
| Weekly | Monthly | Annually |
| Total weekly hours ÷ 40 | Total monthly hours ÷ 173.2 hours (40 × 4.33 average weeks) | Total yearly hours ÷ 2,080 hours (40 × 52 weeks) |
|
Employee A: 40 hours Employee B: 20 hours Employee C: 15 hours Total Weekly Hours: 75 FTE: 75 ÷ 40 = 1.875 |
Logged the monthly working duration of a
department: 1,200 hours Monthly Standard: 173.2 hours FTE: 1200 ÷ 173.2 ≈ 6.93 |
Logged annual working duration of a company:
25,000 hours Annual Standard: 2,080 hours FTE: 25,000 ÷ 2080 ≈ 12.02 |
| Shift scheduling and weekly labor cost | Monthly budget vs. actuals | Strategic hiring & year-end reporting |
Imagine a software implementation project requiring a project manager for 20 hrs/week, Engineer A for 40 hrs/week, Engineer B for 35 hrs/week, and a QA analyst for 25 hrs/week.
Total weekly hours: 20 + 40 + 35 + 25 = 120 hours
FTE: 120 ÷ 40 = 3.0
If your department has a total availability of only 4.5 FTE, this project consumes two-thirds of your capacity.
To simplify FTE conversions and avoid calculation errors, refer to the image below. This conversation table comes in handy during staffing decisions.
| Weekly Hours | FTE value |
| 40 | 1 |
| 35 | 0.88 |
| 30 | 0.75 |
| 20 | 0.5 |
| 10 | 0.25 |
Recalling how to calculate full-time equivalent becomes easier when the process follows a clear sequence of steps.
Begin by compiling a list of employees whose working hours contribute to the organization’s capacity. Record the number of hours each person works within a consistent timeframe. This typically includes:
Determine the number of working hours your organization considers a full-time schedule. Most companies define full-time as 30 to 40 hours per week, with 40 hours being the standard.
This represents 1.0 FTE, meaning the workload expected from one full-time employee.
After establishing the baseline, apply the formula discussed in the previous section. Example:
FTE: 340 ÷ 40 = 8.5 FTEs
The final and one of the most crucial steps is understanding what the FTE number means for operations. The project or resource manager compares available FTE capacity with project demand, staffing plans, and budget expectations. When demand exceeds available FTE, teams may need to:
Common issues include:
If one team reports weekly hours and another reports monthly, the aggregated FTE becomes misleading. This is why many firms link FTE with timesheet software and resource management systems to maintain consistency.
Understanding of FTE becomes more profound when you connect it to business planning. FTE is not just a reporting metric. It directly influences delivery timelines, labor costs, margin targets, and strategic growth decisions.
When workforce data is converted to full-time equivalent units, leadership can measure true capacity against demand instead of relying on assumptions or raw headcount.
Capacity planning is fundamentally the tug-of-war between demand and supply. Where supply is the available FTE capacity and demand is the required FTE to complete planned work.
If demand consistently exceeds supply, delays, burnout, and quality issues follow. If supply exceeds demand, costs rise and productivity drops.
Using FTEs allows managers to:
For example:
To understand how FTE supports workforce planning, consider a simple capacity planning scenario. Suppose a department currently has 12 full-time equivalent (FTE) employees available, but the pipeline of upcoming projects requires 14.5 FTE to complete the planned work on schedule.
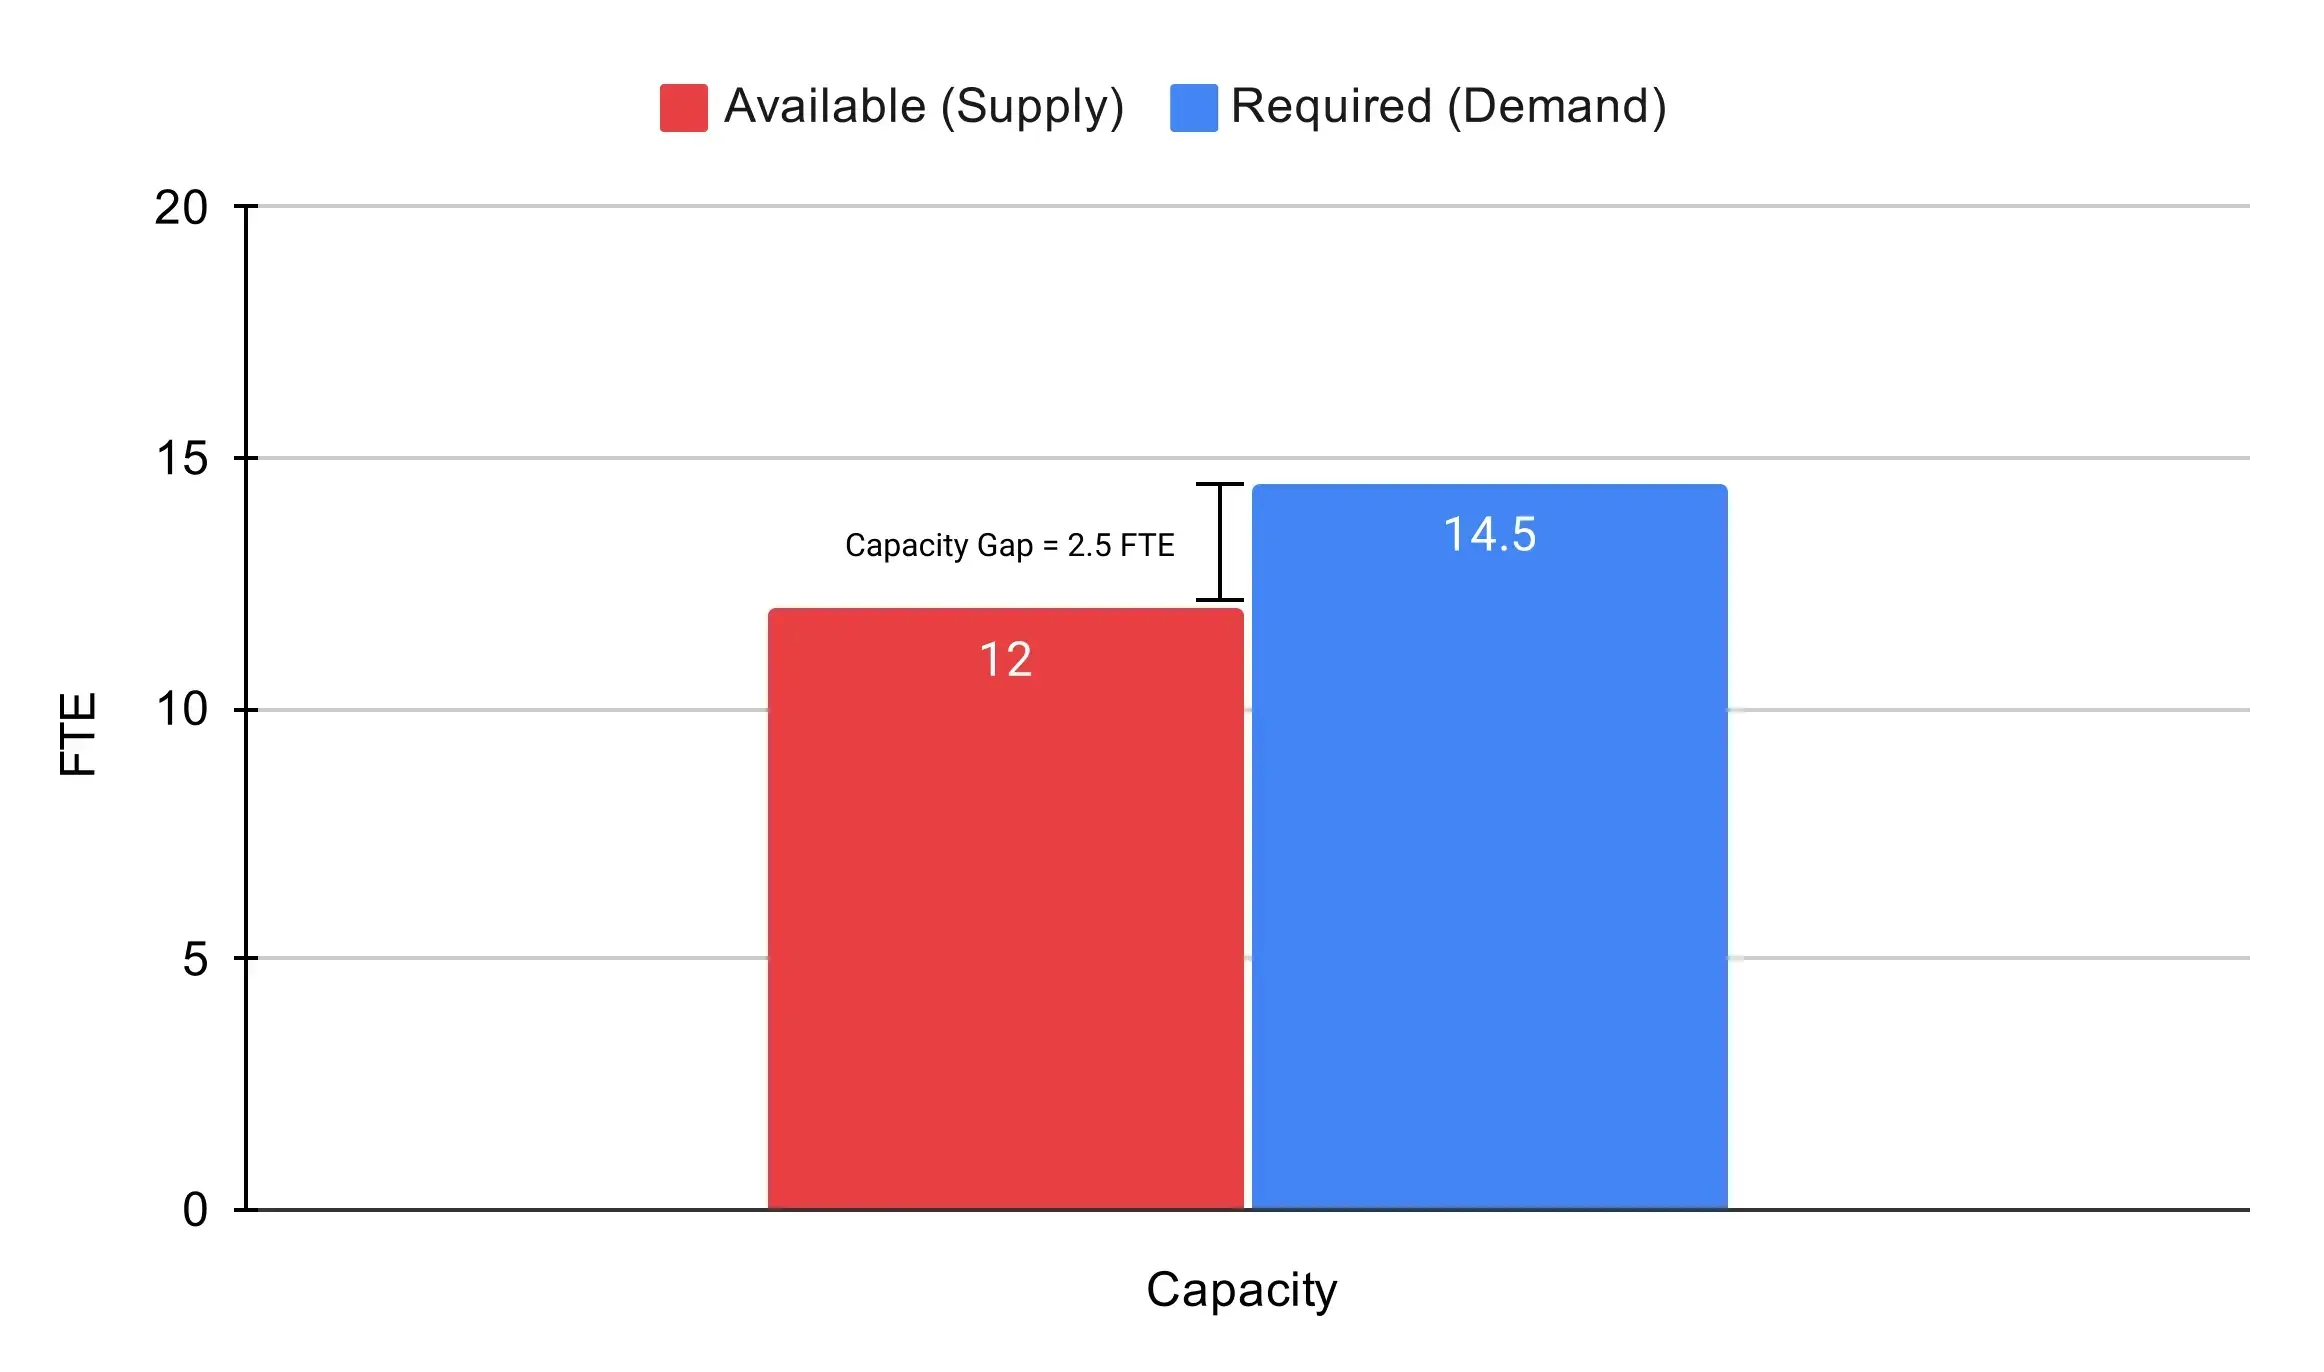
How to interpret the graph:
In this example, the organization faces a capacity shortfall of 2.5 FTE because the upcoming project workload requires 14.5 FTE, while only 12 FTE are available. This means the current workforce lacks sufficient capacity to execute the entire project pipeline within the expected timelines.
In business terms, that gap of 2.5 FTE represents:
Without this visibility, leaders may approve new projects assuming headcount is sufficient, only to discover delivery constraints mid-cycle. FTE-based capacity planning reduces reactive decisions and replaces them with forecast-driven workforce alignment.
FTE turns abstract workload pressure into measurable capacity gaps.
Labor is one of the largest operating expenses for most organizations. Converting workforce hours into FTEs standardizes financial modeling. Each FTE carries a total employment cost that includes benefits, base salary, payroll taxes, equipment, tools, workspace, and overhead allocation.
Example: Average annual cost per FTE is $110,000. The cost for 20 FTEs will be 110,000 x 20, totalling at $2.2 million in annual labor expense.
Because FTE is standardized, finance teams can:
In professional services, revenue targets are often set on per FTE basis. For instance, if the revenue target per FTE is $180,000, the revenue target for 15 billable FTEs will be 180,000 x 15, which rounds to $2.7 million. This creates a direct relationship between staffing levels, utilization rates, and financial performance.
When FTE data connects with financial dashboards, leadership can monitor:
| Utilization Type | Overutilization | Underutilization |
| Key Indicators | Sustained allocation above 1.0 FTE per employee, Continuous overtime weeks, Backlogged deliverables, Rising attrition risk | Employees allocated at 0.6-0.7 FTE for extended periods, Low billable ratios in client-facing roles, and idle project hours not reassigned |
| Business Impact | Higher burnout risk, declining morale, quality issues, and increased turnover costs | Increased labor cost without proportional revenue, reduced productivity, and margin pressure |
| What It Signals | Workforce demand exceeds available capacity | Available capacity exceeds current workload |
Tracking FTE across multiple projects provides early visibility into these patterns, allowing managers to rebalance assignments before issues surface in quarterly financial results.
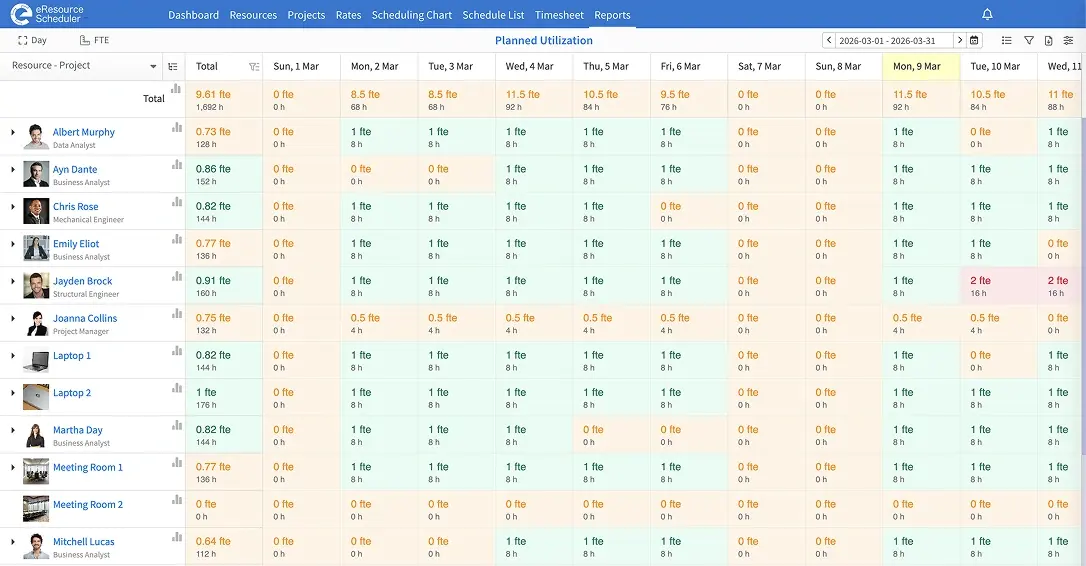
As organizations grow, manual FTE becomes unreliable. A modern resource management and scheduling system, such as eResource Scheduler, is designed for teams that need clarity into people, projects, and capacity across multiple initiatives. It supports:

The growing trend is to integrate FTE metrics directly into dashboards rather than calculate them separately in spreadsheets. This reduces errors and supports faster workforce decisions. Industry-agnostic teams in consulting, IT, engineering, healthcare, and professional services rely on a structured resource management tool to keep FTE aligned with real-time workload changes.
Full-time equivalent transforms workforce hours into standardized resource scheduling metrics. It bridges HR, finance, and project management. When calculated consistently and monitored regularly, FTE gives leaders clarity on staffing levels, budget exposure, and delivery capability.
In an environment where hybrid schedules, contract roles, and cross-functional teams are common, FTE provides a shared language for decision-making. If you want to see how workforce visibility performs in practice, book a personalized demo of eResource Scheduler to explore the platform in action.
1. What does 1.0 FTE mean?
1.0 FTE represents the total workload equivalent to one full-time schedule based on your organization’s defined full-time hours. This workload may be covered by one full-time employee or multiple part-time employees whose combined hours equal a full-time schedule.
2. How many hours equal 1.0 FTE annually?
In most U.S. organizations, 1.0 FTE equals 2,080 hours per year. This number is calculated by multiplying the standard 40-hour workweek by 52 weeks in a year. It represents the total annual workload expected from one full-time employee under a typical schedule.
3. Why do companies calculate FTE monthly instead of yearly?
Many organizations track FTE monthly because workforce demand often fluctuates throughout the year. Monitoring FTEs monthly allows leaders to detect capacity gaps, budget shifts, and workload changes much earlier than annual reviews.
4. How do you combine full-time and part-time employees when calculating FTE?
Add all employee hours and divide by the full-time weekly standard. Example:
4 employees × 40 hours + 3 employees × 25 hours = 235 total hours
FTE = 235 ÷ 40 = 5.88.
Headcount: 7 employees; Work capacity: 5.88 FTE
5. Why is FTE important for budgeting and forecasting?
FTE links workforce capacity to labor costs, helping leaders estimate expenses, forecast hiring needs, and plan staffing more accurately. When tracked with a resource scheduling software, such as eResource Scheduler, teams can combine timesheets, capacity planning, financials, and management reports to align workforce demand with budgets.


Plan Smarter. Schedule Faster. For Free.
Join thousands already using eResource Scheduler to align teams, time, and tasks seamlessly.
 ALL FEATURES INCLUDED