As popular and powerful as Gantt charts are for monitoring workflow and project progress, they are also difficult to analyze, difficult to customize, and time-consuming to update and share with all key stakeholders. It’s okay to admit that you aren't a fan of these charts. Luckily, there are alternatives in the marketplace, such as "global resource management," that are equally, if not more, effective and don't stretch your budget.
In this guide, we will explain how Gantt charts rose to popularity and discuss five alternatives that will make life easier and more efficient for you as a project manager.
Gantt charts are a visual tool primarily used for monitoring project status and viewing project interdependencies. Henry Gantt developed these bar-graph type charts in 1915 to monitor the development of the Hoover Dam project and measure the productivity levels of employees.
While initially Gantt charts were used in construction projects, today they can be found in almost any project environment. Gantt charts are commonly used for the following purposes:
Determining all necessary project tasks
Monitoring project lifecycle
Tracking project milestones
Keeping employees in loop
Understanding interdependencies among projects and resources
Identifying which resource is assigned to a task
Visualizing multiple schedules
Streamlining workflows to improve productivity
Gantt charts have become the bread and butter of project management because of all the things they can tell you about a project. However, this doesn’t mean that they don’t have their fair share of challenges. Next, we discuss the disadvantages of relying only on Gantt charts for managing your project.
Over the years, project managers have been searching for alternatives to Gantt charts. Why? There are several limitations to using Gantt Charts and we explain those inconveniences further.
As useful as Gantt charts are, they are quite difficult to set-up in the first place. And if you have a complex project with multiple schedules, shifts, and moving parameters, then you definitely need a subject-matter-expert to design the chart for you. If the Gantt chart isn’t set-up right, then it loses its value and functionality.
Once a Gantt chart is developed, it provides a single point of visibility into the project. So, this actually limits one’s understanding of the project scope and makes it difficult to prepare for unexpected challenges or contingencies.
Often these charts can get difficult to read and interpret. This generally happens when you factor in milestones, interdependencies, assets, deadlines, and accomplishments. All these data points complicate the reading and take away from the usefulness of the graph.
Imagine a Gantt chart for a large project. It will contain many tasks and subtasks, and one won’t be able to understand what is going on at a “glance.”
The majority of Gantt charts have to be updated manually. So, anytime you have a change in priorities, deadlines, or resources, someone will be responsible for entering the change and ensuring all interdependencies reflect the said change. It won’t be done automatically in real-time. Thus, Gantt charts take away a significant chunk of time where project managers could be working on more productive tasks. Also, outed data and charts aren’t accurate and impede effective teamwork and decision making.
So why do people continue to use Gantt charts when they aren’t the best? It’s because many aren’t aware of other tools and methodologies. We have done the legwork for you and are thrilled to present our top five Gantt chart alternatives.
Here are five alternatives that are easy to learn and implement. Read up to find one that’s right up your alley and can help you effectively manage your projects and resources.
Yes, lists. Just like we make personal “to-do” lists, you can monitor projects by building task lists. However, these task lists are slightly more detailed. Alongside each task, it will list out the timeline and resources for it, so there is no confusion or discrepancy. Lists are helpful in breakdown a project, however, it doesn’t offer a quick, one-shot glance at the overall project scope and timelines.
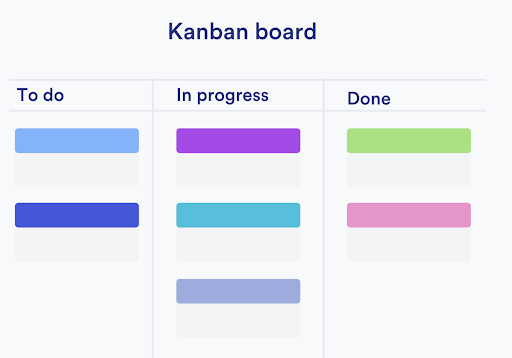
Kanban boards, made popular by the Toyota manufacturing process, is a visual, control, and resource scheduling software that makes use of cards and columns. These cards indicate which tasks have to be completed. Each card (task) moves through the columns (left to right) till it’s considered done.
Kanbans work well for projects that don’t have many interdependencies and can be completed in a single process. The issue with Kanban boards is that they don’t offer any information on the resources responsible for completing a task nor do they present a granular view of the entire project.

Scrum boards, also known as sprint boards, are another visual tool to manage or organize projects by breaking them down into smaller time fragments or “sprints.” The Scrum boards are typically part of larger Scrum processes and are developed from a project management strategy called Agile.
The simplest Scrum board has three columns (much like Kanban boards) with titles “To-Do,” “In Process,” and “Done.” Sticky notes are used to place tasks in their appropriate columns. The disadvantage with Scrum boards is that a Scrum master has to manually move tasks from one column to another. Another limiting factor is that it doesn’t provide any global resource management capabilities of identifying the right candidate for each job. It also doesn’t provide any insight into the financial status of the project.
This alternative to Gantt charts presents insights into project scope, interdependencies, timelines, and budget. However, the visual representation is done via a “web” pattern. A series of arrows and boxes will display the sequence of tasks and the shortest path they can take to be completed. The length of each arrow shows the ‘time’ assigned or projected for each job. These boxes and arrows also show the interconnections between project activities and resources.
Project network diagrams are ideal for larger tasks within a project. This also makes them a good way to gauge an overall project’s scope. They too have limitations — no ability to plan and manage resources, no project financial overview, and no capability to understand overall employee productivity.
Seeking a Gantt chart alternative that is automatic, customizable, and capable of handling complex projects? Investing in a global resource management software can help you allocate resources, set and track multiple project milestones and workflows, and monitor resource productivity and utilization.
The greatest advantage of investing in a global resource management software as an alternative to Gantt chart is that it is capable of doing so much more in a shorter and more efficient way. Hear us out. With a dedicated, you can identify the right resources, schedule them, and make project adjustments in real-time. Another perk of a global resource management tool is that they provide various financial and status reports (including Kanban boards and Gantt charts) so you can ensure the project stays within budget. The platform also aids you in creating capacity plans for pipeline projects.
Seeking a user-friendly and visual way to manage your resources and projects that doesn’t have the limitations of a Gantt chart? You can turn to Scrum or Kanban boards, but we say invest in a global resource management software. It’s a more holistic solution that promotes accountability, flexibility, and collaboration amongst all members of a project.
From simple task allocation and global resource management to capacity planning and tracking project finances, eResource Scheduler helps you improve project collaboration and increase work productivity — empowering you to get more done. Start your free, 14-day trial today.
Plan Smarter. Schedule Faster.
Join thousands already using eResource Scheduler to align teams, time, and tasks seamlessly.