Trying to manage and grow your business by just doing things on the fly might work temporarily. It’s not a long-term strategy for success. Every business or team has to reflect back to understand what made a certain project a success or failure. Did the costs align? Was the project done within a specified timeframe? Were there adequate resources?
Only by creating and analyzing reports will they be able to take data-backed decisions on how to further steer operations. However, there’s another issue. There are multiple project management reports and which ones do you need to track?
Find out the different resource management reports that are important and understand which ones would be crucial to track for your business and/or project.
Project resource reporting is the process of collecting, analyzing, and communicating important project and resource metrics such as status, progress, utilization, obstacles, and costs.
The information from these reports can be used to track the progress of the project, identify any potential problems, and make decisions about resource allocation.
Project resource reporting typically includes the following information:
Project resource reporting can be used to track the following aspects of a project:
Now we cover the top five, most commonly used resource management reports.
Utilization Reports
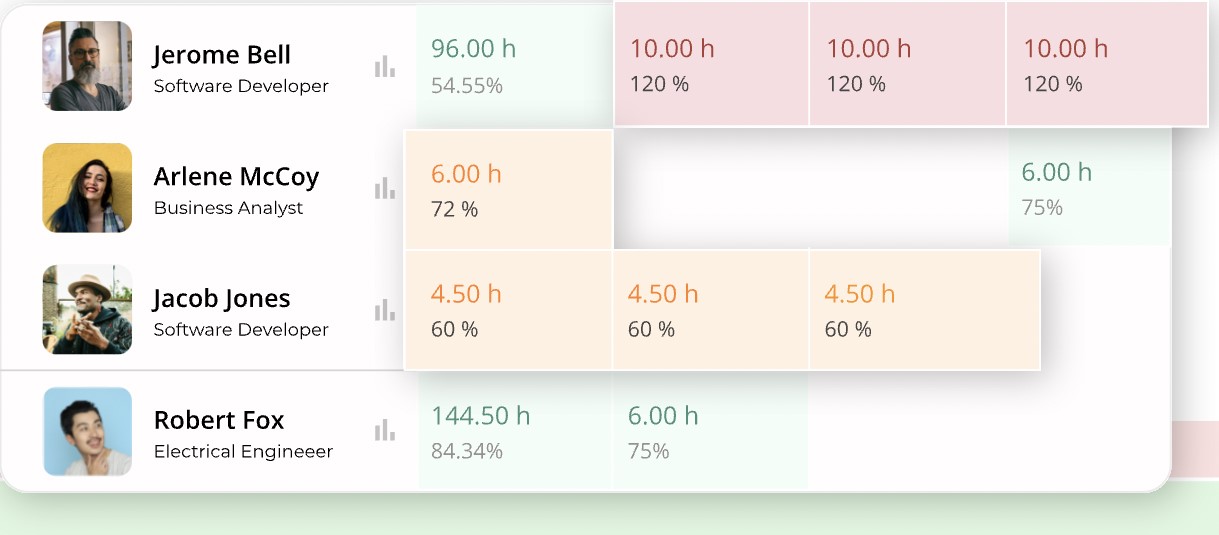
A utilization report tracks how effectively resources are being used. This report identifies if and where resources are being underutilized or overutilized. Utilization reports are generally presented as a percentage. The formula is simply:
Resource Utilization = Number of hours worked / number of available hours.

Planned vs. Actual Time Taken (Utilization)
Another important and insight report is that of planned time for a task vs. actual time taken. This metric gives insights into whether the planning was done correctly and also if your resources need any upskilling or training. For instance, if engineer A takes 3 hours to perform a task over the assigned hour and a half, it’s an immediate red flag. The manager can see this report and step in to identify the root cause.
Cost Variance Reports
Variance means difference and that’s exactly what a cost variance report indicates. It shows the difference between the planned or estimated costs of a project vs. the actual costs. Cost variance reports are the most commonly used financial measurement tools for a project or resource. Variance can be presented as an absolute value or a percentage.
Capacity Reports
Capacity reports tell you how much work is possible to get done within a certain time frame. Capacity reports are typically reported by the “number of hours a resource is available to work.”
There are two kinds of capacity reports — historic and predictive. Historic reports will show you at what capacity the resources worked in previous projects. Predictive reports on the other hand are essential to planning for upcoming projects as they will tell you whether you have the right and sufficient resources to take on more work.
Below are a few key questions capacity management reports can help you answer:
Availability Reports
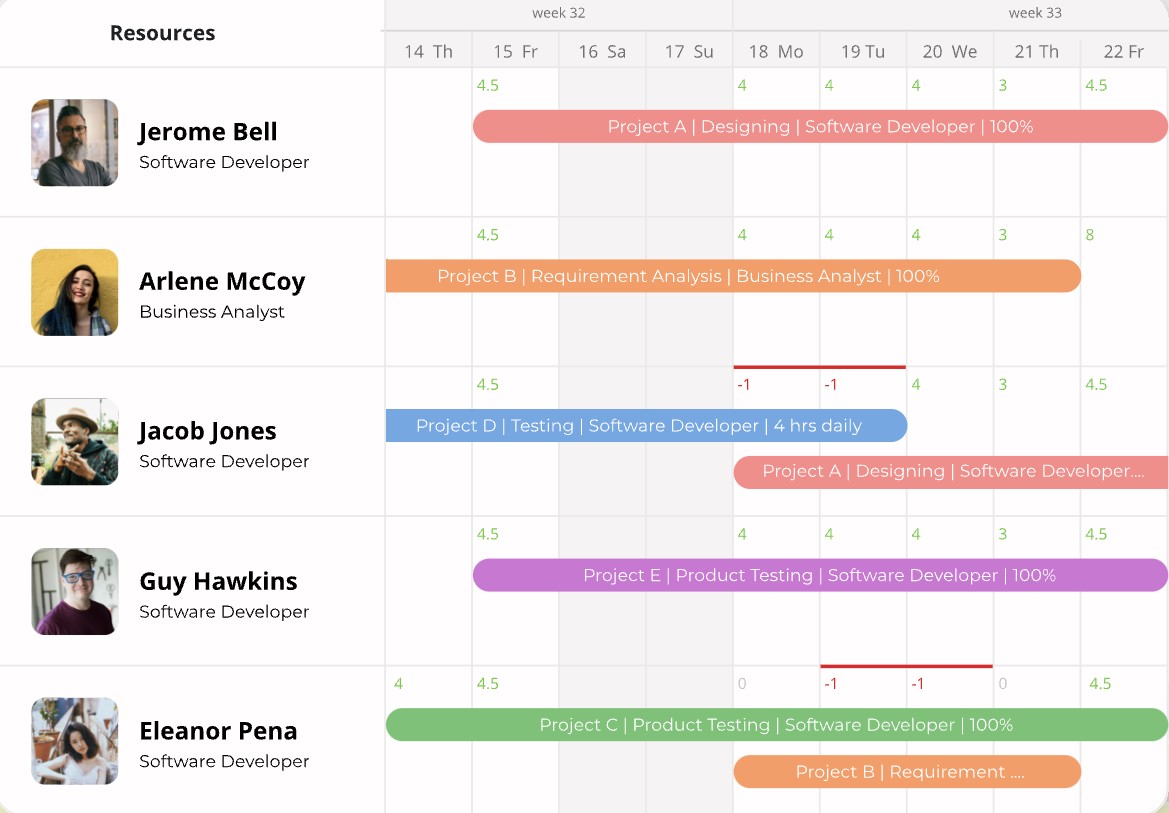
This is probably one of the first reports to create and start tracking before starting any project. An availability report shows how much work and time each team member has on their hands. In addition to showing what is available, it will detail out what resources are needed.
Most resource management softwares show each resource’s availability in a weekly or monthly calendar form, similar to the example we’ve highlighted below.

Here are some additional tips for creating effective resource management reports:
Not all organizations will need the same reports. It is important to customize the reports to the specific needs of the organization so that they are useful and informative.
The reports should be easy to read, understand, and interpret. Avoid using technical jargon or terms that may not be understood by everyone.
Using charts, graphs, and other visualizations can help to make the data more understandable and to identify trends. Studies have shown that visual reports lead to quicker decision-making.
The reports should be updated on a regular basis to reflect changes in resource availability, utilization, and allocation. This can be easily done if one invests in a resource allocation tool as reports are automatically updated in real-time.
The reports should be shared with key stakeholders so that they can make informed decisions about resource allocation. One way to make this a consistent practice is to set a date in the calendar for reviewing reports.
Use these tips and create effective resource management reports that can help you to improve the efficiency and effectiveness of your resource allocation.
Organizations can improve their resource management process and ensure that resources are being used efficiently and effectively by regularly generating and reviewing the most critical resource reports.
To ensure success in your projects, the right perfect resource reports must be implemented to document and assess real-time project progress.
Looking for a resource management system that has all the key management reports in one, centralized place? Why not try our product, eRS? It's one of the best enterprise management resource allocation solutions in the market that’s also pocket-friendly.
Plan Smarter. Schedule Faster.
Join thousands already using eResource Scheduler to align teams, time, and tasks seamlessly.